TileLogicTM             
 
Menu

Contour Generation

Contour Generation
1

Grid Spacing

1. Grid Spacing
 
To create contour lines, TileLogic Office creates a regularly space grid representation (or model) of the field.  This value is the X and Y spacing within the grid.  It is recommended that this value be close to the actual survey performed when gathering data.  Ex. A field survey data gathered on roughly 100' spacing, then select a value of 100' or possibly 75 or 125.  The accuracy of the final contours, are largely dependant on how well dispersed the original survey was done.
 
2

Countour Spacing

2. Countour Spacing
 
Drop down selection of contour spacing options in feet, .5 to 5.0.  This is the elevation change interval to place a contour line at.  Ex. Select .5 to draw contour lines every .5 feet of elevation change.
 
3

Generate

3. Generate
This will (re)generate contour lines based on grid spacing & contour spacing.  This is only necessary when initially creating or changing contour spacing / grid.  Once generated, contour lines are persistent.  Note that contours will only be generated for data on layers which are currently ON.
4

Label Color

4. Label Color
Opens a color selection window, which allows the color selection to be used with contour labels.
 
5

Font

5.  Font
Opens a font selection window, which allows for the font selection / size of contour labels.
 
6

Line Smoothing

6. Line Smoothing
Enable smoothing of contour lines.  Currently, smoothing is only on or off, and levels of smoothing are intended for future releases.
7

Label Percentage of Line

7. Label Percentage of Line
 
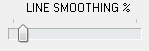
Percentage of line to label, 10 to 50 percent.  Selecting the maximum 50% for example, will label all contour lines as the halfway point of each lines length, and 10% will label each line at every 1/10 the contour lines length.  Select for best map display.
8

Major Contour Interval

8. Major Contour Interval
A drop down selection list, 2 to 10 for the major contour interval.  If you have specfied for example 1 foot contour spacing, and select a major interval of 4, then every 4th contour line is considered a major interval, representing a 4 foot elevation change.  Major interval lines can then be a different color, width or the only ones labeled, or any combination.  This allows for ease of reading, especially when many elevations are represented.
 
9

Major Interval Color select

9. Major Interval Color select
Opens a color selection window, which allows the color selection to be used with major contour lines.
 
10

Major Interval color

10. Major Interval color
Displays the current color selection for the major interval lines.
 
11

Major Interval Line Width

11. Major Interval Line Width
Select the line width for major interval contour lines; 1 to 5.
12

Minor Interval Color select

12. Minor Interval Color select
Opens a color selection window, which allows the color selection to be used with major contour lines.
 
 
13

Minor Interval Color

13. Minor Interval Color
Displays the current color selection for the minor interval lines.
 
14

Minor Interval Line Width

14. Minor Interval Line Width
Select the line width for minor interval contour lines; 1 to 5.
<TODO>: Insert description text here...
15

LABEL Options

15. LABEL Options
 
Allows labeling options for lines; Label major intervals only, label all lines, label no lines.
 
16

UPDATE button

16. UPDATE button
 
Updates the contour lines to most recent settings chosen.
 
17

EXIT button

17. EXIT button
 
Quits the contour settings window.