C. Design - mode available only when a network (Landrain) profile has been selected from the Profile control.
Run strictly to the pre-designed target line from a network file (Landrain). Min slope and Target depth are disregarded in this case.
Tip: Mode, min slope, and target depth all may be changed while in Control mode. When changed, will only recalculate from your current position forward.
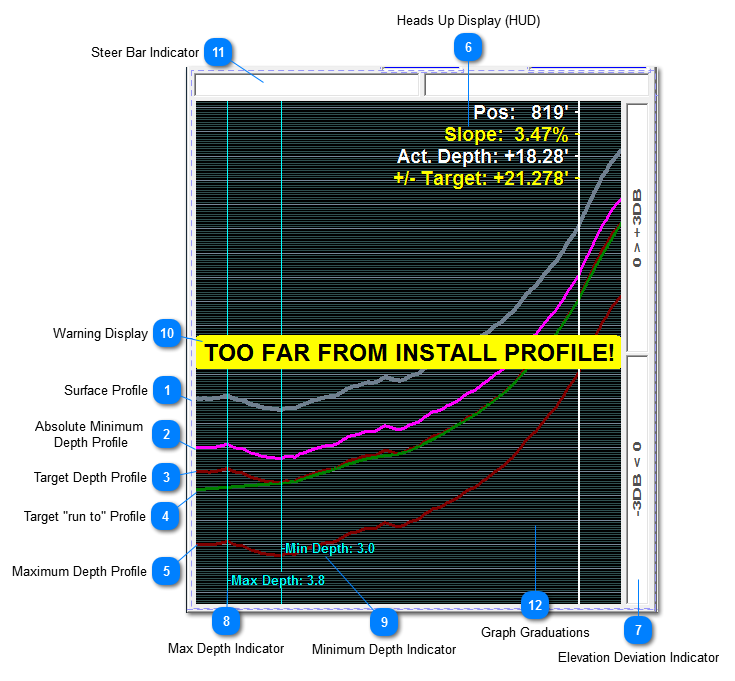
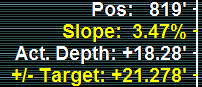
Normally the HUD displays information pertaining to the machines location within a a profile.
- The position along the profile line.
- The slope at this position.
- The actual depth below the surface.
- the deviation from the target elevation (of the tile's profile)
However, the user may press on the profile display (touch screen) or click and hold down the left mouse button to show the following information at any point along the profile:
- The position along the profile line.
- The slope at this position.
- The calculated invert depth below the surface.
- The calculated invert elevation.
This may be done at any time, regardless of "auto control" or not.

 - The position along the profile line.
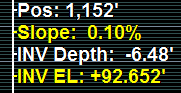 - The position along the profile line.